
This week’s Fist Bump goes out to VectorLink’s Data Analytics and Visualization team as well as to VL Mali, VL Nigeria and VL Zambia for supporting NMCPs to optimize the deployment of vector control tools and evaluate their impact by to integrating epidemiological, entomological, and coverage data.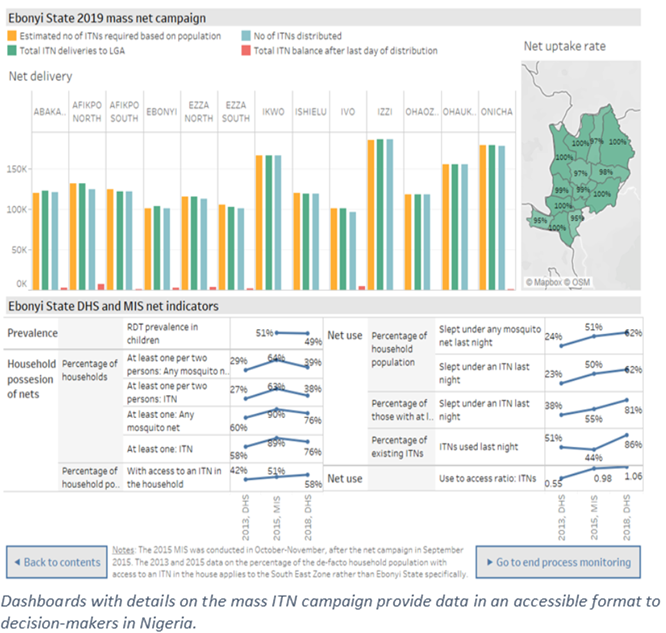
Data use is key to developing strategies to adapt to insecticide resistance and can facilitate effective use of new vector control tools in IRS and ITNs. VectorLink’s timely and relevant data offer decision-makers the information needed in easily accessible and actionable reports or data dashboards. This work, and its impact, is showcased in three case studies that are now available on the PMI VectorLink website.
- In Mali, PMI VectorLink supported vector control decisions regarding which type, how many, and where new Interceptor G2 insecticide-treated nets should be deployed to reduce malaria case incidence and combat insecticide resistance.
- In Nigeria, PMI VectorLink is using data to mitigate the impact of insecticide resistance. This case study explores the opportunity and challenge of using new nets formulated to combat insecticide resistance, and how dashboards are being used to support a PBO ITN evaluation.
- In Zambia, PMI VectorLink compiled and visualized over 600 data points in vector composition and insecticide resistance to inform the selection of the right vector control products for the right locations.
The case studies include interactive visualizations so users can further explore the data. These case studies represent just a small part of VectorLink’s integrated data analytics and visualization work, which currently supports nine PMI VectorLink countries and a portfolio of 15 vector control evaluations.
Congratulations to VL’s Integrated Data Analytics and Visualization team, including Sarah Burnett, Emily Beylerian and Mkhululi Ngwenya, who worked closely with VL Mali, VL Nigeria and VL Zambia on these studies. Kudos to all for showing us the data!